With any luck, your family’s summer has been packed with the best our area has to offer: swimming in the James River, casual walks around Hollywood Cemetery and Maymont, checking out the latest blooms at Lewis Ginter Botanical Garden, or enjoying an afternoon at the 17th Street Market. Maybe you’re planning to visit the Carytown Watermelon Festival later this month or catch a few late-season Flying Squirrels baseball games with the family.
If so, you’ll notice some of these places feel hotter than others. I’m not talking about popularity; I mean the temperature of the air.
We know hot days are a part of Richmond summers, but in some parts of the city – like The Diamond and the patio at River City Roll (a bowling alley in Scott’s Addition) – it can be as much as sixteen degrees hotter than other parts of the city at the same time on the same day. Why is that? It’s the urban heat island effect in action.
Cities like Richmond are full of hard, impervious, and dark surfaces, such as asphalt parking lots, wide roads, and brick buildings. Much like the feeling when you wear a dark shirt on a sunny day, these surfaces absorb and hold more of the sun’s energy during the day and then re-emit it back into the air during the afternoon and night. In other words, these human-made structures physically amplify and extend heat waves.
Richmond also lacks shady trees and other vegetation in these areas where we have a lot of impervious surfaces, and new development rarely replaces vegetation that is lost. This missing greenery decreases the amount of shading and evapotranspiration (basically, a plant’s method of sweating like we humans do) to cool down these parts of the city. Evaporation of water is an endothermic reaction, meaning it removes energy (in this case, heat) from the environment in order to occur. This, in turn, cools the surrounding area.
Taken together, these two variables can tell us a lot about a city’s potential for a heat island effect.
How Did Scientists Measure Heat Effect and What Did We Find?
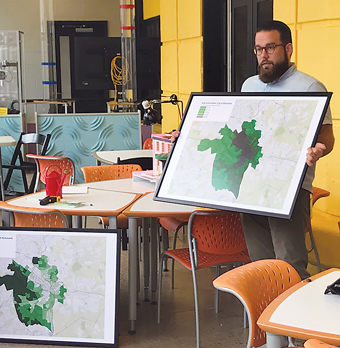
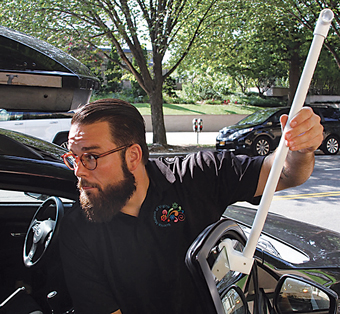
In order to measure Richmond’s urban heat island effect, volunteers from various organizations used precise electronic temperature sensors hanging out of the passenger windows of cars, paired with GPS units running at the same time, to keep track of where we were and how hot it was every second. We collected data for an hour at a time at 6 a.m., 3 p.m., and 7 p.m., to provide an approximation of the coolest, hottest, and early evening temperatures. We threw out data collected when we were stopped, moving too slowly, or moving too fast so we could be confident in the data’s quality. In total, the team of volunteers collected over 100,000 temperature readings across the City of Richmond.
In a case of classic scientific serendipity, we were fortunate to make our observations during the major heat event that occurred that summer on July 13, 2017. With maximum air temperatures reaching 99°F at Richmond International Airport and record-breaking average (88°F) and minimum (77°F) temperatures, we had the perfect weather to understand how our city’s design either strengthens or reduces heat extremes.
Our results identified a 16-degree difference between the warmest and coolest spots in the city during the hottest time of the day (3 p.m. to 4 p.m.). As you might guess, the coolest places had lots of dense shade and plants (the Dogwood Dell Loop trail and Stratford Hills), while the hottest places were industrial areas with very little tree cover (Scott’s Addition and Shockoe Bottom). Most of the hottest places also remain at these elevated temperatures well into the evening.
Why Does This Matter to You?
Follow-up study of the hottest areas reveal some alarming trends that, depending on where your family spends time this summer, could have a major impact on health and safety. I’m not just suggesting wearing lighter clothes and drinking more water – I’m talking regular rest periods indoors, out of the sun and humidity.
Additionally, in the hottest areas of Richmond, there were higher rates of ambulance responses and higher rates of urgent care center/emergency department admissions for heat-related illnesses, as well as more people suffering from asthma and mental health distress. There is also clear potential and some evidence for higher summertime energy use to cool our spaces in those areas. And to think, this is all because of how these neighborhoods are designed.
What Can We Do to Address This Heat Disparity?
You still have a month before summer ends. Your family can spend some of that time making a plan for what you can do to lessen the impact of the urban heat island effect. Here are some ideas:
1. Voice your support for local tree-planting programs in areas of the city that lack green spaces.
2. Join discussions about Richmond 300, the city’s comprehensive plan for the next twenty years. Visit Richmond300 to learn more.
3. Talk to local lawmakers about strategies the city can employ to recover lost vegetation.
4. Stay alert to meteorologists’ warnings about extreme heat, including checking in on elderly, chronically ill or disabled neighbors who might need extra help during the next heat wave.
While the term urban heat island effect might sound like a city-specific phenomenon, the results of this study suggest amplified temperatures are experienced far outside Richmond City limits. Any human-made structures with vast expanses of dark, hard surfaces, and limited shading – like outdoor malls, for example – could be places where hot temperatures are made more extreme, requiring us to be vigilant with how long we spend outside without appropriate cooling.
As the climate continues to warm here in central Virginia, we’ll experience longer, hotter heat waves. My hope is that urban heat island data might be the start of a blueprint for what our communities can do to prepare for them.
WOULD YOU LIKE TO KNOW MORE?
Read the full report featuring Richmond’s urban heat island results, along with data collected in Baltimore, MD, and Washington, DC.


